Genetic Methods of Species Identification
- Introduction
- Genetic IDs
- Using Phylogenetic Trees
- Identification Using Evolutionary Relationships
- Estimating the Phylogenetic Tree
- Statistical Support (Was it just Luck?)
- DNA Barcoding
- BLAST
- Are these Methods Reliable?
Using Phylogenetic Trees
This approach is implemented in DNA Surveillance (dna-surveillance.fos.auckland.ac.nz:23060).
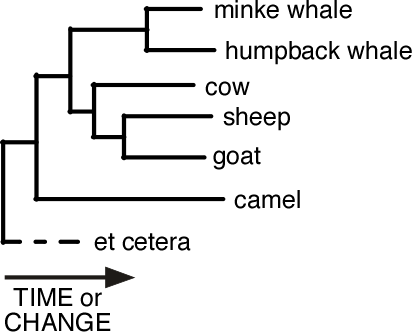
Evolutionary relationships can be represented in a phylogenetic tree. Think of it as a family tree of species. When the tree is drawn horizontally, closely related species are at the ends of branches (horizontal lines) which start at a node (vertical lines).
The length of a branch indicates either the amount of elapsed time or the evolutionary change between one node and the next. Each node represents a common ancestor of all the organisms to the right of it.
The relatedness of two species is indicated by how far back (leftward) you need to trace their ancestry until you reach a common ancestor. So in the tree shown here, sheep and goat are more closely related to each other than either is to cow. Also both sheep and goat are equally related to cow. The tree could equally have been drawn with sheep and goat reversed.
Identification Using Evolutionary Relationships
The basic idea of using evolutionary relationships to identify specimens is that
- if we build an evolutionary tree using the unidentified specimen and a set of reference gene sequences from known animals, then
- the unidentified specimen will be most closely related to other members of its species.
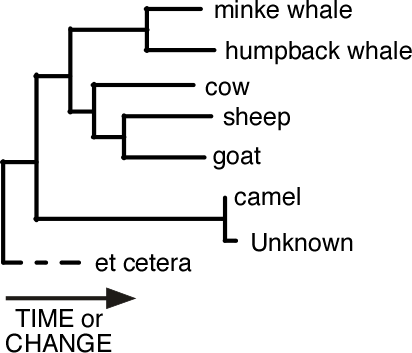
Here the Unknown specimen is very closely related to camel and we might decide that it was from a camel.
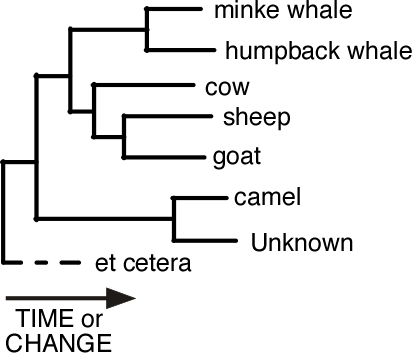
However, this approach depends on the reference collection containing all known species. Sometimes a species is missing. Perhaps it is rare or perhaps its gene sequence has not yet been determined. If the Unknown happens to belong to this unrepresented species then, when we build the tree, we will get something like this. The tree says that the Unknown is related to camel. It certainly isn't a cow or goat. But the length of the branch between the Unknown and its common ancestor with the camel is relatively long. What could it be?
Estimating the Phylogenetic Tree
So where did that phylogenetic tree come from? Evolutionary biologists have, for a very long time, been building evolutionary trees from analyses of physical characteristics of organisms. They have done this primarily by applying logic to the problem; looking at where in the fossil record we find organisms with a particular trait and then thinking about which traits must have evolved before others. It is much more difficult to do that with genetic sequences, in part because most of our evidence is from modern specimens. So, phylogenetic trees are estimated computationally by applying a particular type of reasoning many times with the aid of a computer.
The simplest methods for computing the tree are statistical methods called clustering. Clustering involves drawing diagrams with the most similar things linked together, and progressively more different things linked more distantly. To use clustering we need some way of measuring similarity (or its inverse, distance) of genetic sequences. The simplest measure of distance between two sequences is the proportion of positions in an alignment at which they differ. So if two sequences are the same at 98, and different at 2, out of 100 positions, then we would say that they have a distance of 0.02 (2%).
Once we have estimated the genetic distance between all of the pairs of sequences then we can proceed to cluster them. We begin by finding the pair which is most similar, i.e. has the smallest genetic distance, and then we join them. Now we consider them as a unit. Then we find the next closest pair of sequences, including the group that we have just constructed, and we join them together. We repeat this process any times until all of the sequences have been added to the tree. It might be that some sections of the tree get build separately and are joined to the rest of the tree only at the end of the procedure.
Of course, this description of genetic distance and clustering is not the whole story. We need to make statistical corrections for the possibility that evolutionary changes have occurred more than once at a position in the sequence alignment. Also we need to decide where those changes have occurred in the history of the organisms, and so we use other statistical procedures to decide how many changes should be assigned to each branch of the phylogenetic tree.
Another group of more sophisticated methods search through the very large number of possible trees to find the best one. That best tree might be the one which predicts the fewest number of evolutionary changes needed to produce the alignment that we observed. Or, it could be the tree with the greatest probability of giving the observed sequences given some statistical model of molecular genetic evolution.
Statistical Support (Was it just Luck?)
We only ever estimate evolutionary relationships, but these estimates are not wild guesses. We can assess how well the relationships are supported by the data. How good is the estimate? How strong is the evidence for it, and not another set of relationships? If the evidence for the relationship is weak then we doubt that the relationship is correct; it is probably the result of some slight variations in the genetic sequences.
The approach that we use to test the strength of the evidence is called bootstrapping. It's different from the most commonly used methods of statistical testing. Say that you have a large container of coloured beads, red and blue, and you want to know the proportion of each. Usually you would take a sample and count the beads. This gives you a single estimate but you don't know how much variation there might be in your estimate. Perhaps the beads are not mixed very well. So you take another sample, and another, and so on. Now you might compute the mean proportion of say red beads in all your samples, and then get an estimate of the variation in your samples by computing the standard deviation. This approach assumes that the total number of beads is large compared to the size of your samples.
The bootstrapping approach is more cautious. First you take a sample of say 100 beads and count how many reds it contains. You then return the beads to the container, give it a big stir, and select another random sample of 100 beads. You do this many times, each time counting how many reds you found. Now you ask how often did I get 50 reds out of 100 beads? 60 reds? 70 reds? This gives a sampling distribution of reds.
We do something similar with gene sequences. We randomly select individual nucleotide positions from the sequence alignment until we have a sample that is the same length as the original sequence. Then we estimate the phylogenetic tree for it. We repeat this many times. Now we look at all of those phylogenetic trees and ask how frequently did we find the individual relationships that we got in our first tree.
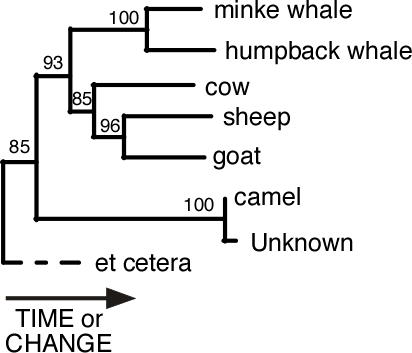
In this example, the two species of whales occurred together every time while the sheep and goat were closest 96% of the time. This is strong evidence for these relationships. If these numbers had been less that 70% then we would begin to doubt the reliability of the result.
Notice that the Unknown and the camel were closest relatives 100% of the time, and that the Unknown is on a very short branch. This is very strong evidence that the Unknown is a camel.
© The University of Auckland 2020 | disclaimer