Using DNA Surveillance
Using DNA Surveillance is straight forward:
- Select the appropriate organismal database.
- Paste a DNA sequence from the specimen you wish to identify in the query window
- or, select a file containing multiple sequences to be tested.
- Choose the appropriate reference database.
- Optionally choose to perform a BLAST search.
- Optionally select a number of bootstrap replicates and consensus threshold.
- Click Submit.
The results are presented as a phylogenetic tree and a table of genetic distances. There are several options for manipulating the layout of the tree. Both the tree and the table can be exported.
Submitting a query sequence
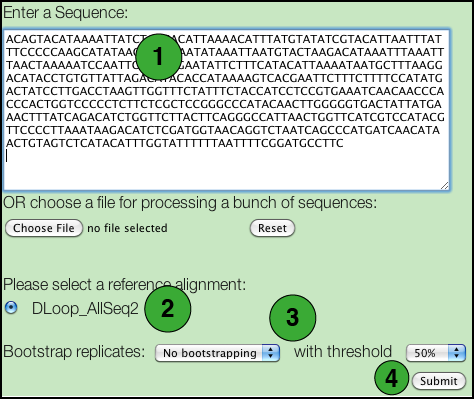
- Paste a DNA sequence in the box.
There are some restrictions: - Only FASTA and plain text formats are supported.
- Nucleotides may be in either lower or upper case letters (acgt or ACGT).
- All IUPAC nucleotide symbols are supported (but not gaps; see next).
- A sequence should not contain any extraneous characters such as spaces, '-', '?', '.', although it may be broken into several lines.
- Select the specific database you wish to use.
- If you wish to perform a BLAST search, tick this box.
- If you wish to perform a bootstrap analysis, select the number of replicates from the drop down list and the threshold to be used. The default 50% value corresponds to the most commonly used value for majority rule consensus. Using a higher value increases the number of replicate trees that must share a clade for it to be reflected in the majority rule consensus, and consequently to have a support value shown on the tree.
- Click the Submit button.
Submitting multiple sequences
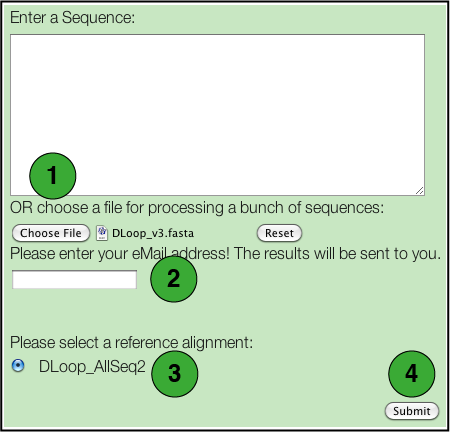
- Select a file containing the DNA sequences to be tested.
Each sequence will be tested individually and a separate set of results will be generated for each. There are some restrictions: - Only files in FASTA format are supported.
- Nucleotides may be in either lower or upper case letters (acgt or ACGT).
- All IUPAC nucleotide symbols are supported (but not gaps; see next).
- A sequence should not contain any extraneous characters such as spaces, '-', '?', '.', although it may be broken into several lines.
- Enter an email address to which the results will be sent.
- Select the specific database you wish to use.
- Click the Submit button.
Note that neither the BLAST search or the bootstrap option is available for batch analyses.
When an analysis runs
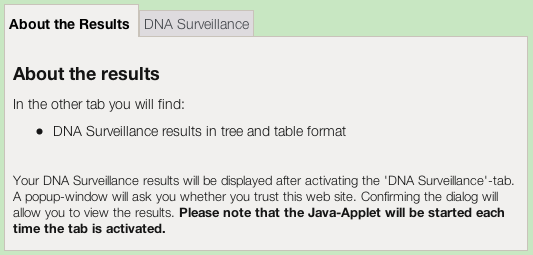
The results first appear as a set of tabs.The tree-based results appear when you click on the DNA Surveillance tab.
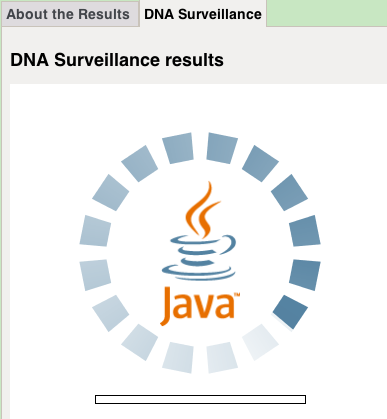
The first time you use DNA Surveillance you will be prompted to give permission for the Java applet to run on your computer. The applet will perform some of the computing necessary to display the results on your screen. It will also need to access your hard drive if you chose to save any results to your local computer. If you want to continue, then you need to grant approval, as below.
Then the Java applet will load and then display your results.
Viewing the Results: Tree and Table
The results are first presented as a tree. Species identity is inferred from considering the position of the query sequence on the tree and the distance to the nearest reference sequence.
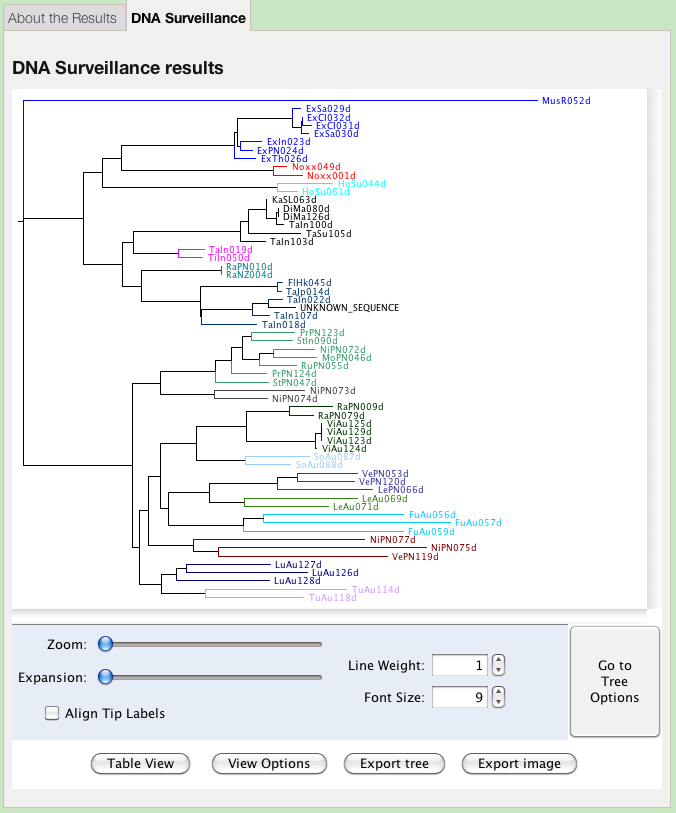
The colours of the clades in the tree represent groups defined by the administrator of the database. They may, or may not, represent species. This view offers options for changing the presentation of the tree:
- Zoom
- Increase the magnification of the tree both horizontally and vertically
- Expansion
- Increase the magnification of the tree vertically only
- Line Weight
- Change the thickness of the lines, in pixels
- Font Size
- Change the size of the letters, in points
- Align Tip Labels
- Present all labels at the right hand side, separated by dots from the end of their respective branch
- View Options
- A toggle to hide or reveal the tree viewing option controls
- Export tree
- Save the tree in Nexus or Newick format, for importing into different tree viewing software
Unfortunately this function does not work in Safari under Mac OSX, but works with other 64-bit browsers. - Export image
- Save an image of the tree as currently displayed, for importing into word processing, presentation or image manipulation software
Unfortunately this function does not work under Mac OSX. You can export the tree, view it in an external visualisation program, and obtain an image. - Table view
- View the results as a table of genetic distances
- Go to Tree Options
- View a set of options for determining the labelling and layout of the tree
Displaying Information on the Tree
The tree may be annotated with different types of information.
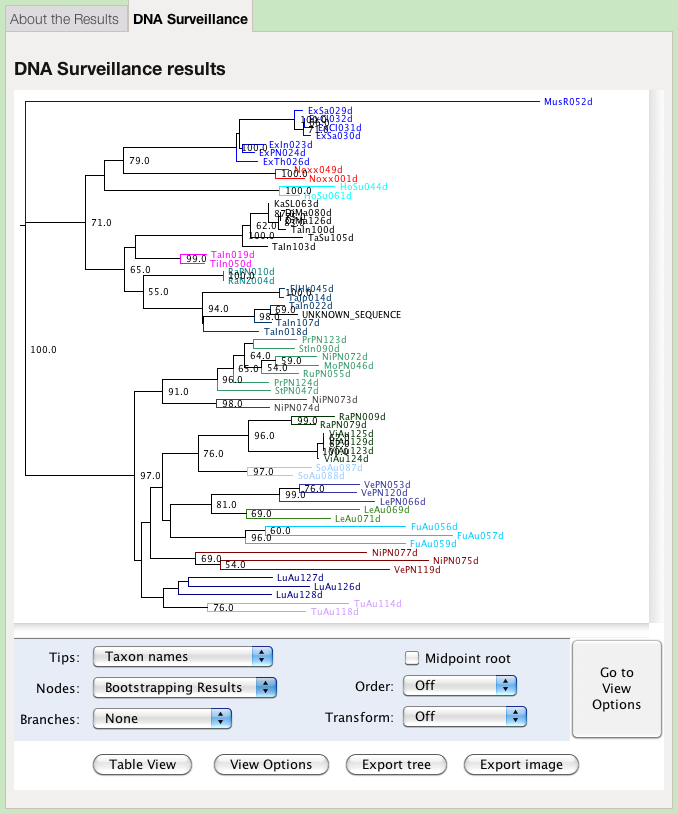
The tree options enable you to change how the tree is labelled and presented:
- Tips
- Choose which of the annotations is displayed at the tips of the tree. The taxon names are given by default.
- Nodes
- Choose which information to display at the nodes. Use this option to display bootstrap support values. The Node Age is the difference between the distance of the node from the root and the distance from the root to the tip most distant from the root. Branch Lengths shows the length of the branch subtending the node.
- Branches
- Choose the information to display on a branch. Node Ages shows the age of the daughter node. See above for an explanation of how this is calculated. Branch Lengths shows the length of the branch.
- Midpoint root
- Place the root at the midpoint of the longest path between any two tips. This might potentially place the outgroup within the ingroup, and render the ingroup paraphyletic.
- Order
- Rotates clades so that the density increases or decreases on the page. This does not change any of the relationships, but only their presentation.
- Transform
- Changes the presentation from a phlyogram (Off) to a cladogram. The tree is presented as a phylogram by default.
Table of Genetic Distances
The table of genetic distances can be viewed and saved.
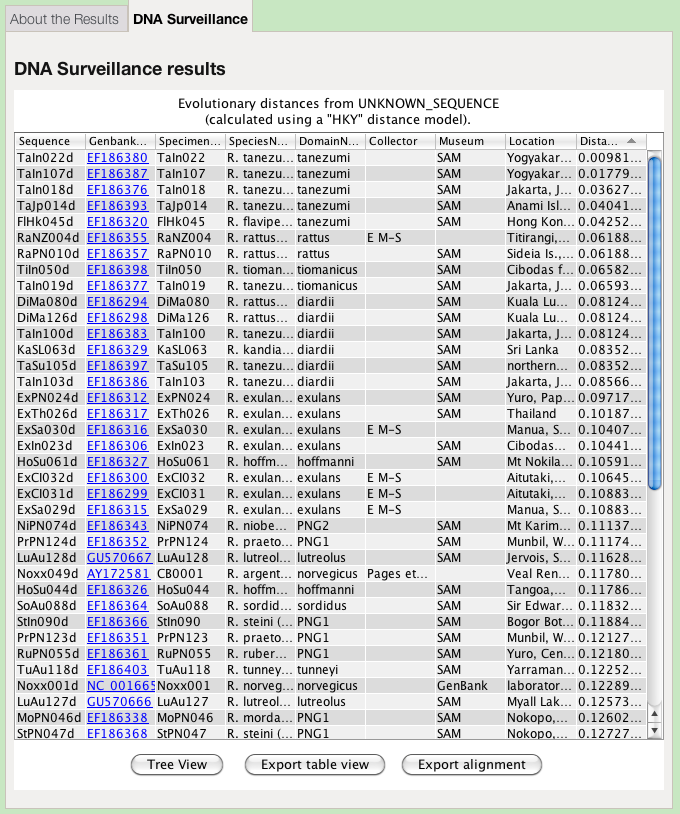
The table view of the results contains several columns, many of which are defined by the administrator of the particular database:
- Sort
- The results are sorted by genetic distance by default, from lowest to highest. The table may be resorted by clicking on any of the column headings. Clicking a second time on a column heading reverses the sort order.
- Column width
- The columns may be resized by dragging the bars separating the column headings.
- Export table view
- Save the table, using one of several field delimiters, for importing into spreadsheet or database software.
Unfortunately this function does not work in Safari under Mac OSX, but works with other 64-bit browsers. - Export alignment
- Save the alignment as a FASTA or PHYLIP format file, for importing into phylogenetics software. This option is available only when the database administrator has enabled it.
Unfortunately this function does not work in Safari under Mac OSX, but works with other 64-bit browsers.
© The University of Auckland 2020 | disclaimer